Author: Ulrich Speidel
A considerable number of ISPs in remote locations, operators of ocean-going ships (in particular cruise ships), and aircraft on intercontinental routes face user demand for reliable and fast Internet connectivity but can’t get fibre or radio links to terrestrial networks – either because it’s physically impossible or because it’s economically prohibitive. This leaves satellite Internet as the only option.
Until the advent of medium earth orbit (MEO) provider O3b, geostationary (GEO) satellites were the only option for such ISPs. That meant huge dish antennas and, most of all, bandwidth prices of many hundreds of dollars per megabit per second per month.
‘High throughput’ satellites with direct-to-site transmission have brought the dish size down in some areas of the world, but are generally aimed at end users, not at ISPs who will redistribute the service via their terrestrial network.
O3b (short for ‘Other 3 billion [users]’) are now part of a larger satellite operator, SES, which also offers a large range of GEO services. O3b’s original sales push was that it offered significantly reduced latencies (around 120 ms round-trip time rather than 500 ms plus for GEO). Echoes of this can still be found around the net. At the time of writing this, however, a search for ‘latency’ on the SES website finds mostly blog posts from O3b’s pre-SES era, and the term certainly doesn’t feature prominently on the site.
For Pacific Island ISPs and Internet people in the region, connectivity is always a challenge. More often than not I get the message from them that they’re confused by the choices available to them when it comes to satellite service. Some have found themselves locked into long-term contracts with satellite providers that they have subsequently found didn’t meet their needs. So it’s quite understandable that there is a bit of anxiety around.
Part of the problem lies in the fact that satellite operators – the people who design, sell, and install satellite networks – tend to be communication engineers, that is they come from an electronic engineering background. Their world revolves around bands, fade margins, antenna gains, noise, rain fade, footprints and signal levels. ISP people tend to be computer networking people. Their world revolves around subnets, gateways, routers, network address translation, traffic shaping, latencies and congestion.
I understand both of these communities well having worked across all layers of the communication stack, from soldering around in RF componentry, working with codes, troubleshooting link layer issues and IP networking, all the way up to application layers and security. In my opinion, knowledge from one community can benefit the other.
For example, unwanted effects in the satellite networking world can have different causes. As I’ve already discussed on this blog, packet loss can be the result of links being impaired by rain fade or equipment failure. But it can also be a symptom of queue drops during congestion – a consequence of high demand but not link impairment. Similarly, link underutilisation doesn’t mean that there isn’t enough demand to fill the bandwidth – it’s also a symptom of TCP queue oscillation, the same high demand effect that also causes packet losses by queue drops.
At the University of Auckland, we have built a satellite simulator that lets us gain insight into the workings of such satellite links into island-like networks. Its 140 computers take on the roles of ‘island’ and ‘world’ hosts, simulate the satellite link between them, and observe the behaviour of the link and packet flows across it for a wide range of scenarios.
We can simulate GEO and MEO links for bandwidths up to many hundred Mbps and for up to around 4,000 simultaneously active client sockets. This corresponds roughly to the sort of user load and connectivity of an island like Rarotonga in the Cook Islands.
One of the things it lets us do is compare the expected network behaviour of MEO and GEO links. So we thought this might be of interest to some readers out there.
Simulating network behaviour of MEO and GEO links
Figure 1 shows a comparison between simulated GEO (blue) and MEO (red) links with 32 Mbps in each direction (brown horizontal line) and payload data flowing in the island direction only, for a range of demand levels (load). We’re looking at average total goodput rates observed on the island side (crosses), the average goodput rate observed by a single 80 MB iperf3 transfer (squares), and the average number of TCP connections (flows) seen per second (spiky squares). Each load scenario was simulated ten times, the solid lines represent the average value obtained in the ten simulations, whereas the markers show the actual values seen in each experiment.
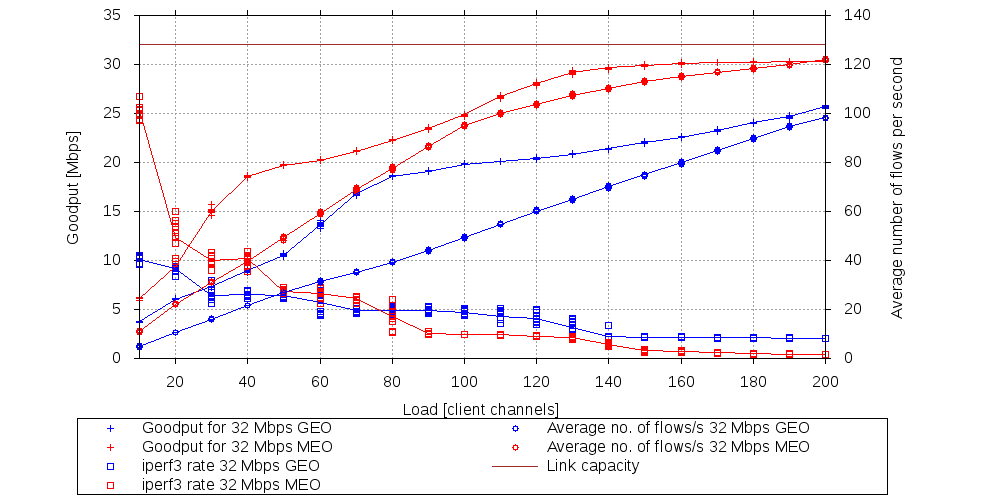
Figure 1: At the same demand level, MEO links complete significantly more connections in the same amount of time than GEO links. However, long TCP transfers under high demand scenarios can take longer as short flows get an unfair advantage on MEO. This global behaviour is the same regardless of link bandwidth.
Each channel represents a TCP socket on the ‘island’ that sequentially connects to a server on the ‘world’ side. The server then chooses an amount of data to send to the client. This amount follows an actual satellite flow size distribution observed in Rarotonga. When the transfer is complete, the server disconnects the client. This cycle repeats for the duration of the experiment.
As one would expect, total goodput and number of flows increase with load for both GEO and MEO. However, both are significantly larger for MEO across the entire load range.
This is a result of the difference in RTT between the two link types. Each load channel alternates between two phases: the connection establishment phase, during which no goodput accrues; and the connected phase, which covers the actual data transfer.
On a GEO satellite, the connection establishment phase takes significantly longer than on MEO, due to the higher latency. As the vast majority of flows is small (10 data packets or less), they spend most of their time in the connection establishment phase. As the lower MEO latency shortens the duration if this phase, we get faster connection turnaround, more flows and higher total goodput.
However, there is a drawback: The increase in goodput and number of flows per second on MEO accrues more or less exclusively to short flows. Most of these flows don’t live long enough to have their congestion windows adjusted by TCP flow control (the occasional small flow that loses a packet to queue overflow at the satellite input queue does not significantly impact the statistics) – so they don’t back off under congestion, which sets in at a lower load level on MEO than on GEO.
On the other hand, even small amounts of packet loss cause large flows to back off considerably. At medium to large loads, the goodput rate observed for the 80 MB iperf3 transfer on MEO falls below that of the GEO link, despite the fact that both links have in principle spare capacity.
In practice, small flows occur primarily in applications such as simple web browsing (which includes Facebook, Instagram, Twitter) or email traffic (except for large attachments), whereas large flows are typically software downloads.
When we look at packet loss, the percentage of TCP payload bytes that doesn’t make it onto the link in the above scenario is lower for MEO than for GEO, up to a load of around 110 channels. As the load increases, MEO losses quickly outgrow GEO losses — at 200 channels, MEO loses nearly twice as much of its data (~4.8%) as GEO (~2.5%).
Assisting large flows
One way of assisting large flows is to increase buffer size at the input to the satellite link, albeit at the risk of standing queues. While this dampens TCP queue oscillation, it also raises the risk of an effect known as ‘bufferbloat’’ – (LINK TO BLOG ABOVE).
The amount of buffer that is appropriate is generally taken to be proportional to the bandwidth-delay product, which would suggest MEO buffer capacities of around a quarter of GEO size.
We get more flows in MEO, and the RTT is much lower, so we should see more of them — this indicates an even lower buffer size.
However, in our experiments, we tried to optimise the buffer size based on observed queue behaviour – admittedly a bit of a black art – and ended up with GEO queues of 250 kB and MEO queues of 200 kB capacity. So going by theory, our results already give the big iperf3 transfer a massive leg up on MEO, and still it’s not as fast as on GEO under high loads.
So, who wins, GEO or MEO?
From a networking perspective – which is the only one covered here – our data tells us that a MEO solution is likely to make better use of the capacity and as a result transfers more data faster.
As long as the link utilisation stays well below capacity and the demand stays relatively low, it also seems to be the better choice for large transfers.
However, under a high load scenario, large transfers fare much worse in our experiments than under GEO.
Of course, this isn’t the only criterion. You’ll also want to look at price per Mbps/month, at technological suitability/serviceability for your remote and hard-to-reach location, cyclone wind load, rain fade, logistics and so on.
Postscriptum:
The results above were obtained with our pre-2021 tc-based link emulation, which led to inflated goodput values across the board. We have yet to confirm these results with our new emulator, but expect the relative performance of GEO and MEO systems to remain the same.
